Technical Analysis
The Oil Market Journal publishes a wide range of technical analysis reports.
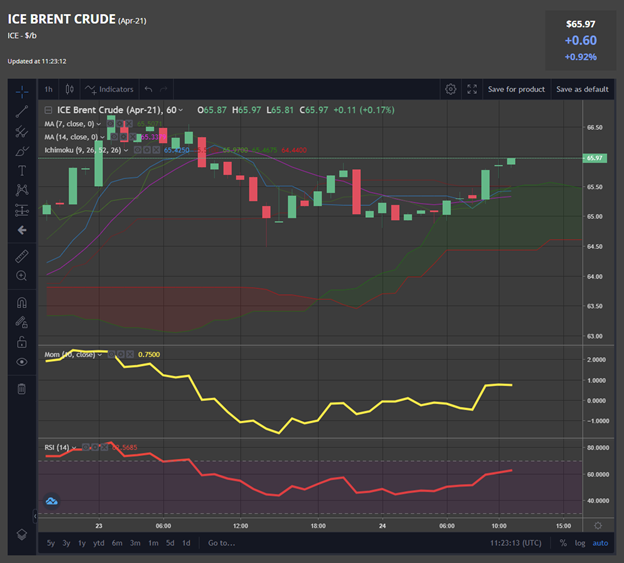
The reports are published each day in pdf format are available for clients by email and online. The graphs include a range of important technical indicators on daily, weekly and monthly line and candle graphs
- Markets covered included:
- Refined oil products
- Biofuels
- Fuel oils
- Oil futures
- Major forex pairs
- Technical indicators:
- Moving averages
- Momentum
- RSI
- Ichimoku Cloud
- Point & Figure
A number of the OMJ Technical Analysis Reports contain trend tables which include short, medium and long term trends for each product within the report.
ICE Gas Oil Point & Figure Report - Case study
This daily report from the OMJ was published on 24th February 2020 when the ICE Gas Oil Future was $485.50/t. The report indicated target prices for ICE Gas Oil of $429/t; $291/t; $205/t; and $185/t.
On 28th April 2020 ICE Gas Oil fell intraday to $181/t.
In addition, OMJ also provides:
- A range of prebuild technical analysis dashboards
- Ability to create personal technical analysis dashboards and watchlists.